Self-monitoring project (deprecated) (FREE SELF)
- Introduced in GitLab 12.7 with a flag named
self_monitoring_project. Disabled by default.- Generally available in GitLab 12.8. Feature flag
self_monitoring_projectremoved.- Deprecated in GitLab 14.9. Planned for removal in GitLab 16.0.
WARNING: This feature is in its end-of-life process. It is deprecated in GitLab 14.9, and is planned for removal in GitLab 16.0.
GitLab provides administrators insights into the health of their GitLab instance.
To provide a native experience (similar interacting with an application deployed using GitLab), a project called Monitoring is created:
- With internal visibility.
- Under a group called GitLab Instance.
The project is created specifically for visualizing and configuring the monitoring of your GitLab instance.
When the project and group are created, all administrators are given the Maintainer role. As an administrator, you can add new members to the group to give them the Maintainer role for the project.
This project can be used to:
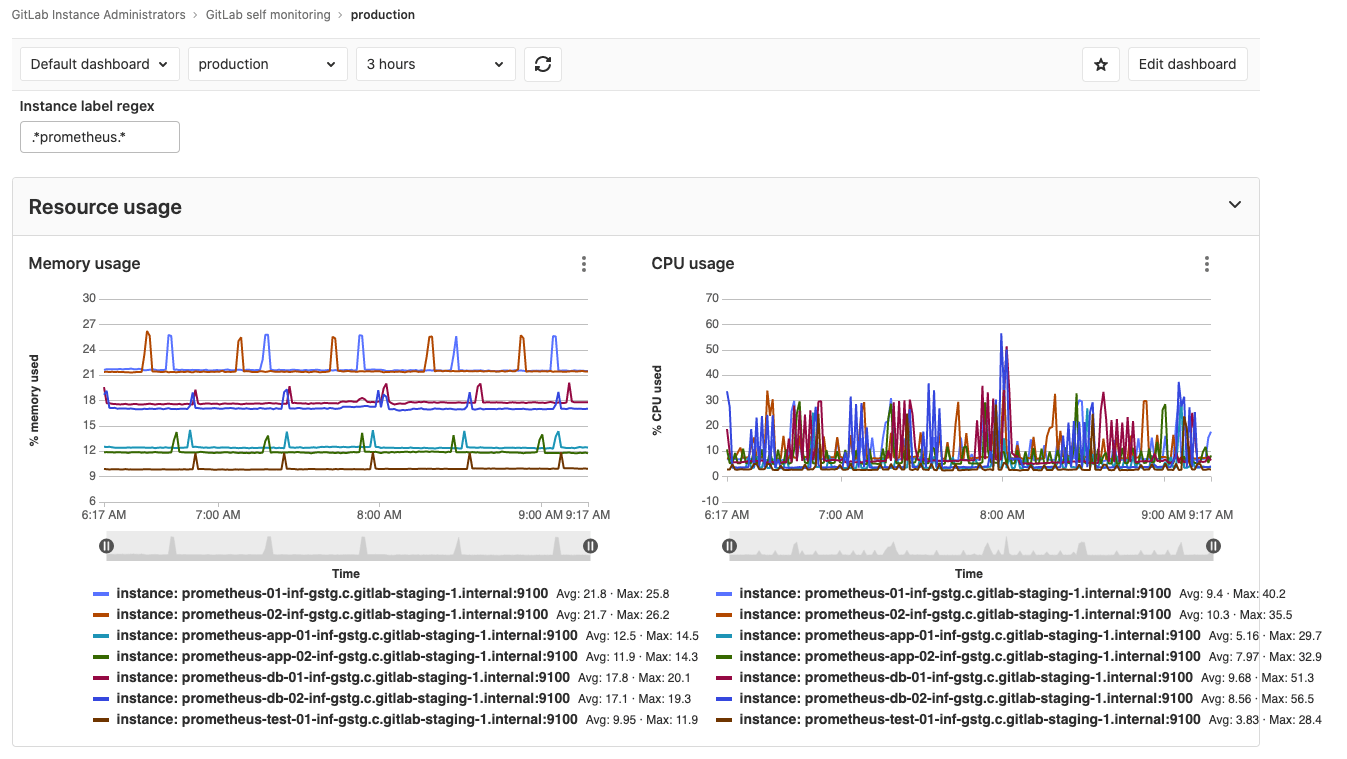
- Self-monitor your GitLab instance. The metrics dashboard of the project shows some basic resource usage charts, such as CPU and memory usage of each server in Omnibus GitLab installations.
- Also configure your own custom metrics using metrics exposed by the GitLab exporter.
Create the self-monitoring project
- On the top bar, select Main menu > Admin.
- On the left sidebar, select Settings > Metrics and profiling and expand Self-monitoring.
- Toggle Self-monitoring on.
- After your GitLab instance creates the project, GitLab displays a link to the project in the text above the Self-monitoring toggle. You can also find it from the top bar by selecting Main menu > Projects.
Delete the self-monitoring project
WARNING: Deleting the self-monitoring project removes any changes made to the project. If you create the project again, it's created in its default state.
- On the top bar, select Main menu > Admin.
- On the left sidebar, go to Settings > Metrics and profiling and expand Self-monitoring.
- Toggle Self-monitoring off.
- In the confirmation dialog that opens, select Delete self-monitoring project. It can take a few seconds for it to be deleted.
- After the project is deleted, GitLab displays a message confirming your action.
Dashboards available in Omnibus GitLab
Omnibus GitLab provides a dashboard that displays CPU and memory usage of each GitLab server. To select the servers to be displayed in the panels, provide a regular expression in the Instance label regex field. The dashboard uses metrics available in Omnibus GitLab installations.
You can also create your own dashboards.
Connect to Prometheus
The project is automatically configured to connect to the internal Prometheus instance if the Prometheus instance is present. This should be the case if GitLab was installed using Omnibus GitLab and you haven't disabled it.
If that's not the case, or if you have an external Prometheus instance or a customized setup, you configure it manually.
Take action on Prometheus alerts (ULTIMATE)
You can add a Prometheus integration to GitLab to receive notifications of any alerts.
When the integration is set up, you can take action on incoming alerts.
Add custom metrics to the self-monitoring project
You can add custom metrics in the self-monitoring project by:
- Duplicating the overview dashboard.
- Editing the newly created dashboard file and configuring it with dashboard YAML properties.
Troubleshooting
Error message in logs: Could not create instance administrators group. Errors: ["You don't have permission to create groups."]
A bug causes project creation to fail with the following error in the log file when the first administrator user is an external user:
Could not create instance administrators group. Errors: ["You don't have permission to create groups."]Run the following in a Rails console to check if the first administrator user is an external user:
User.admins.active.first.external?If this returns true, the first administrator user is an external user.
If you face this issue, you can temporarily make the administrator user a non-external user and then try to create the project. After the project is created, the administrator user can be changed back to an external user.