Monitor your environment's metrics (deprecated) (FREE)
Deprecated in GitLab 14.7.
WARNING: This feature is in its end-of-life process. It is deprecated for use in GitLab 14.7, and is planned for removal in GitLab 16.0.
GitLab helps your team monitor the health and performance of your applications and infrastructure by turning statistics and log files into charts and graphs that are easy to understand, especially when time is short and decisions are critical. For GitLab to display your information in charts, you must:
- Instrument your application - Collect accurate and complete measurements. For an overview, see How to instrument Prometheus metrics in GitLab.
- Expose metrics for capture - Make logs, metrics, and traces available for capture.
- Configure Prometheus to gather metrics - Use applications like Elasticsearch, Prometheus, and Jaeger to gather the data you've exposed.
- GitLab collects metrics - GitLab uses Prometheus to scrape the data you've captured in your applications, and prepares the data for display. For more information, see Collect and process metrics.
- Display charts in the GitLab user interface - GitLab converts your metrics into easy-to-read charts on a default dashboard. You can create as many custom charts and custom dashboards as needed so your team has full insight into your application's health.
Configure Prometheus to gather metrics
You must connect a Prometheus instance to GitLab to collect metrics. How you configure your Prometheus integration depends on where your apps are running:
- For manually-configured Prometheus - Specify your Prometheus server, and define at least one environment.
- For a cluster integrated Prometheus - GitLab can query an in-cluster Prometheus. You must also complete a code deployment to your cluster for the Monitor > Metrics page to contain data. You can do this using Auto DevOps.

Collect and process metrics
After configuring Prometheus for a cluster, GitLab attempts to retrieve performance metrics for any environment with a successful deployment.
GitLab scans the Prometheus server for metrics from known servers like Kubernetes and NGINX, and attempts to identify individual environments. For more information about the supported metrics and scan processes, see Prometheus Metrics library.
To view the default metrics dashboard for an environment that is configured to gather metrics:
- If the metrics dashboard is only visible to project members, sign in to GitLab as a member of a project. Learn more about metrics dashboard visibility.
- In your project, navigate to Monitor > Metrics.
GitLab displays the default metrics dashboard for the environment, like the following example:
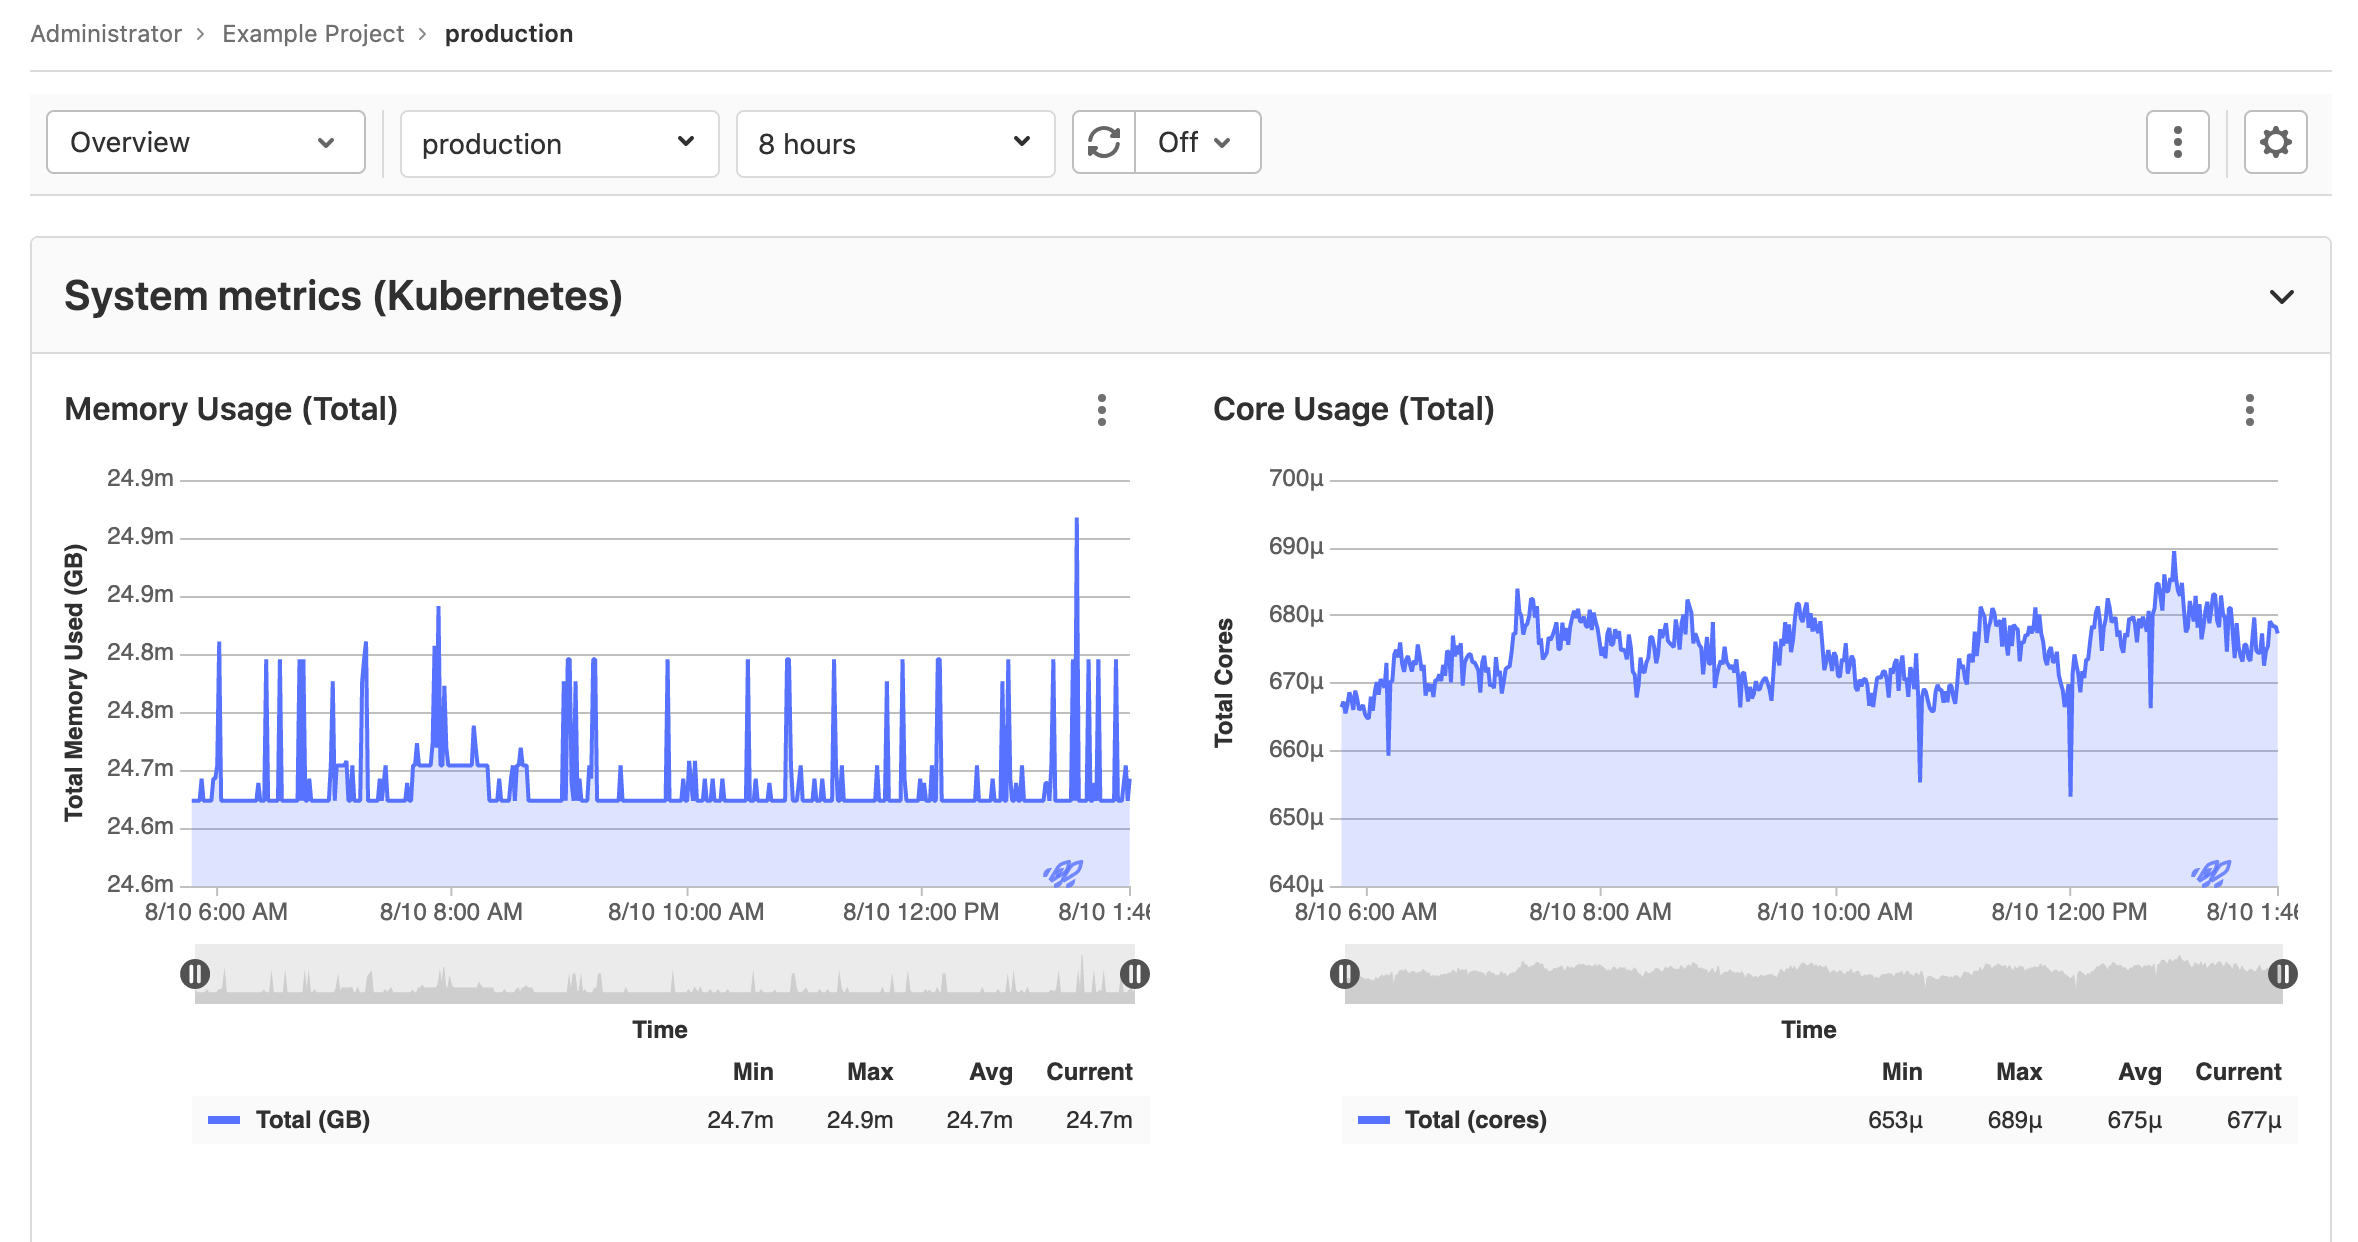
The top of the dashboard contains a navigation bar. From left to right, the navigation bar contains:
- Dashboard - A dropdown list of all dashboards available for the project, with starred dashboards listed first.
- Environment - A dropdown list of all environments that searches through all environments as you type.
- Range - The time period of data to display.
- Refresh dashboard {retry} - Reload the dashboard with current data.
- Set refresh rate - Set a time frame for refreshing the data displayed.
-
More actions {ellipsis_v} - More dashboard actions
- Add metric - Adds a custom metric. Only available on GitLab-defined dashboards. (Introduced in GitLab 12.5.)
- Edit dashboard YAML - Edit the source YAML file of a custom dashboard. Only available on custom dashboards. (Introduced in GitLab 12.5.)
- Duplicate current dashboard - Save a complete copy of a dashboard. Only available on GitLab-defined dashboards.
- Star dashboard {star-o} - Mark a dashboard as a favorite. Starred dashboards display a solid star {star} button, and display first in the Dashboard dropdown list. (Introduced in GitLab 13.0.)
- Create new dashboard - Create a new custom dashboard for your project. (Introduced in GitLab 13.3.)
- Metrics settings - Configure the settings for this dashboard.
Customize your metrics dashboard
After creating your dashboard, you can customize it to meet your needs:
- Add custom metrics: In addition to the GitLab default metrics, you can create custom metrics and display them on your metrics dashboard.
- Configure alerts for metrics: Configure custom alerts for your team when environment performance falls outside of the boundaries you set.
- Trigger actions from alerts: Open new issues for your team (ULTIMATE) when environment performance falls outside of the boundaries you set.
Metrics dashboard visibility
Introduced in GitLab 13.0.
You can set the visibility of the metrics dashboard to Only Project Members or Everyone With Access. When set to Everyone with Access, the metrics dashboard is visible to authenticated and non-authenticated users.
Adding custom metrics
Moved from GitLab Premium to GitLab Free in 12.10.
Custom metrics can be monitored by adding them on the monitoring dashboard page. After saving them, they display on the environment metrics dashboard provided that either:
- A connected Kubernetes cluster with the matching environment scope is used and Prometheus installed on the cluster.
- Prometheus is manually configured.

A few fields are required:
- Name: Chart title
- Type: Type of metric. Metrics of the same type are shown together.
- Query: Valid PromQL query.
- Y-axis label: Y axis title to display on the dashboard.
-
Unit label: Query units, for example
req / sec. Shown next to the value.
Multiple metrics can be displayed on the same chart if the fields Name, Type,
and Y-axis label match between metrics. For example, a metric with Name
Requests Rate, Type Business, and Y-axis label rec / sec would display
on the same chart as a second metric with the same values. A Legend label is
suggested if this feature is used.
Editing additional metrics from the dashboard
Introduced in GitLab 12.9.
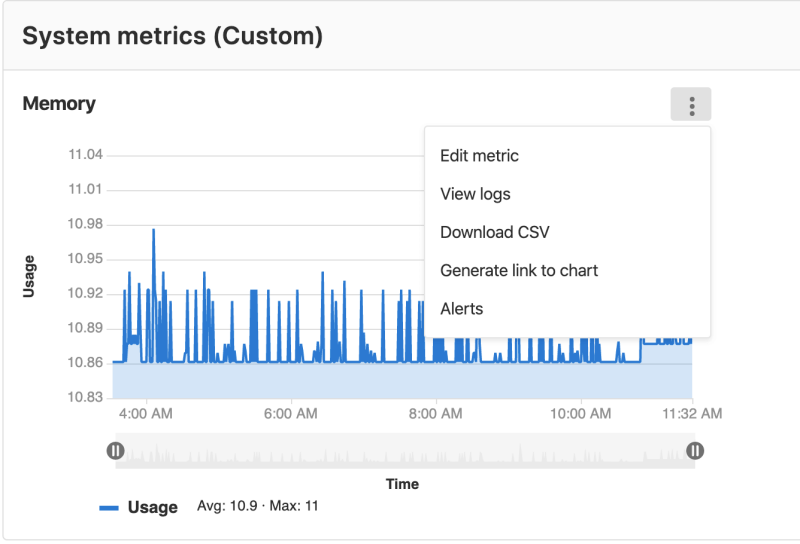
You can edit existing additional custom metrics for your dashboard by selecting the {ellipsis_v} More actions dropdown list and selecting Edit metric.
Keyboard shortcuts for charts
Introduced in GitLab 13.2.
You can use keyboard shortcuts to interact more quickly with your currently-focused chart panel. To activate keyboard shortcuts, use keyboard tabs to highlight the {ellipsis_v} More actions dropdown list, or hover over the dropdown list with your mouse, then press the key corresponding to your desired action:
- Expand panel - e
- View logs - l (lowercase 'L')
- Download CSV - d
- Copy link to chart - c
- Alerts - a