GitLab-defined metrics dashboards (deprecated) (FREE)
Deprecated in GitLab 14.7.
WARNING: This feature is in its end-of-life process. It is deprecated in GitLab 14.7, and is planned for removal in GitLab 16.0.
GitLab provides some dashboards out-of-the-box for any project with Prometheus available. You can duplicate these GitLab-defined dashboards:
To learn about the components of a dashboard, read Metrics dashboard for your CI/CD environment.
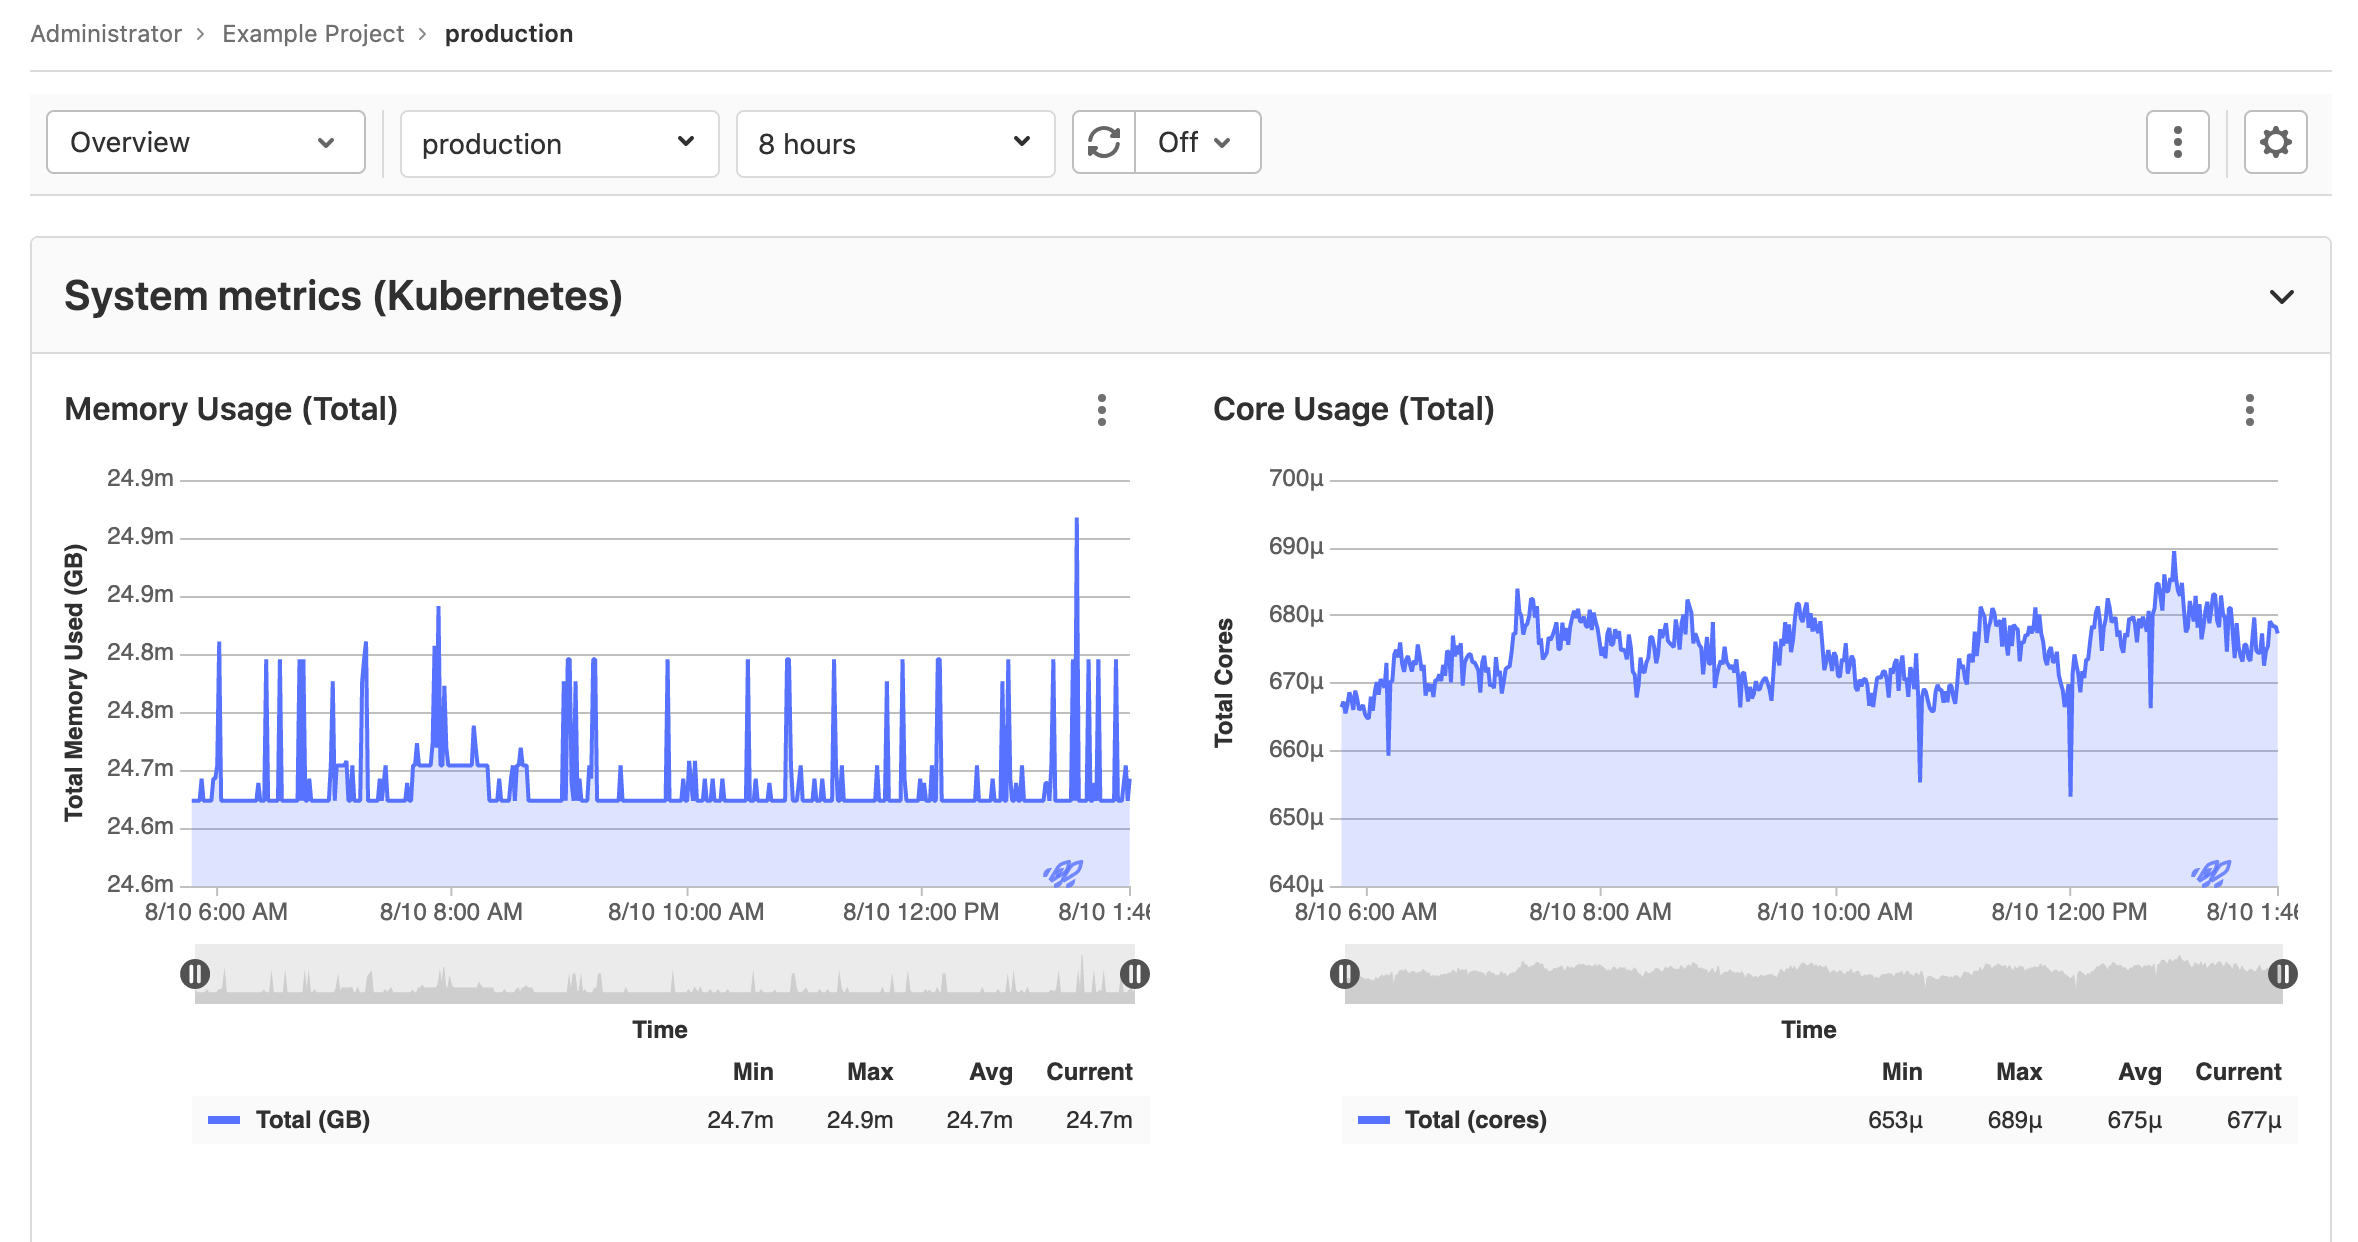
Overview dashboard
This dashboard is the default metrics dashboard. It displays a large number of metrics about the deployed application.
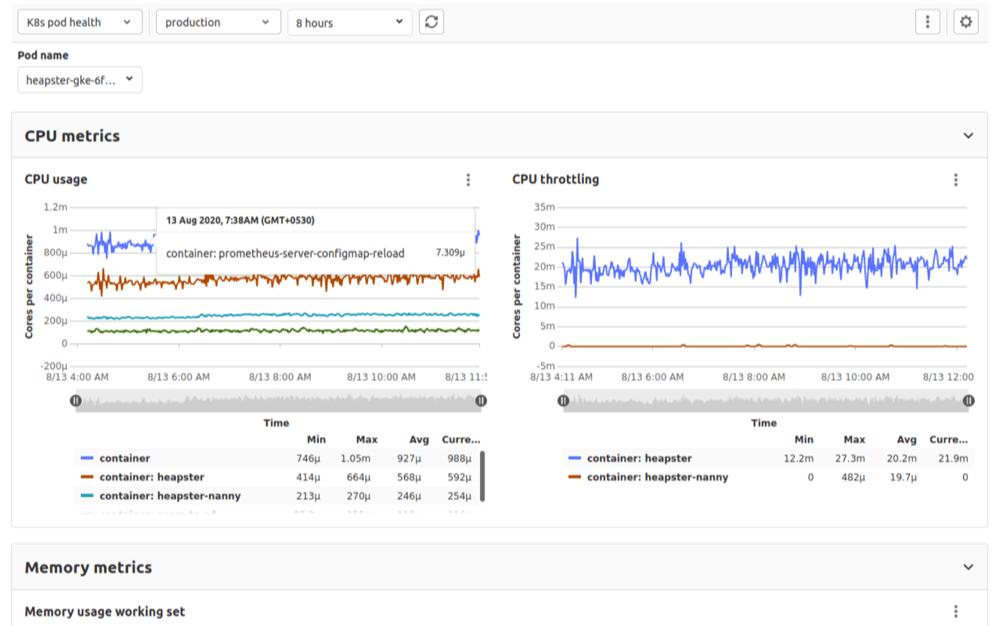
Kubernetes pod health dashboard
This dashboard requires Kubernetes v1.14 or higher, due to the change in metric labels in Kubernetes 1.14.
This dashboard displays CPU, memory, network and disk metrics for the pods in your connected Kubernetes cluster. It provides a variable selector at the top of the dashboard to select which pod's metrics to display.