Error Tracking (FREE)
Deprecated in GitLab 15.9.
WARNING: This feature is in its end-of-life process. It is deprecated for use in GitLab 15.9, and is planned for removal in GitLab 16.0. We are replacing this feature with functionality in the GitLab Observability UI. Please also reference our direction for Observability and data visualization.
Error Tracking allows developers to discover and view errors generated by their application. Because error information is surfaced where the code is being developed, efficiency and awareness are increased.
How error tracking works
For error tracking to work, you need two pieces:
-
Your application with Sentry SDK: when the error happens, Sentry SDK captures information about it and sends it over the network to the backend. The backend stores information about all errors.
-
Error tracking backend: the backend can be either GitLab itself or Sentry. When it's GitLab, we name it integrated error tracking because you don't need to set up a separate backend. It's already part of the product.
- To use the GitLab backend, see integrated error tracking.
- To use Sentry as the backend, see Sentry error tracking.
No matter what backend you choose, the error tracking UI is the same.
Sentry error tracking
Sentry is an open source error tracking system. GitLab allows administrators to connect Sentry to GitLab so users can view a list of Sentry errors in GitLab.
Deploying Sentry
You can sign up to the cloud-hosted Sentry or deploy your own on-premise instance.
Enabling Sentry
GitLab provides a way to connect Sentry to your project. You need at least Maintainer permissions to enable the Sentry integration.
- Sign up to Sentry.io or deploy your own Sentry instance.
- Create a new Sentry project. For each GitLab project that you want to integrate, we recommend that you create a new Sentry project.
- Find or generate a Sentry auth token.
For the SaaS version of Sentry, you can find or generate the auth token at https://sentry.io/api/.
Make sure to give the token at least the following scopes:
project:read,event:read, andevent:write(for resolving events). - In GitLab, enable error tracking:
- On the top bar, select Main menu > Projects and find your project.
- On the left sidebar, select Monitor > Error Tracking.
- Select Enable error tracking.
- In GitLab, ensure error tracking is active.
- On the left sidebar, select Settings > Monitor.
- Expand Error Tracking.
- Ensure the Active checkbox is selected.
- In the Sentry API URL box, enter your Sentry hostname. For example, enter
https://sentry.example.com. For the SaaS version of Sentry, the hostname ishttps://sentry.io. - In the Auth Token box, enter the token you previously generated.
- To test the connection to Sentry and populate the Project dropdown list, select Connect.
- From the Project list, choose a Sentry project to link to your GitLab project.
- Select Save changes.
You can now visit Monitor > Error Tracking in your project's sidebar to view a list of Sentry errors.
Enabling GitLab issues links
You may also want to enable Sentry's GitLab integration by following the steps in the Sentry documentation
Enable GitLab Runner
To configure GitLab Runner with Sentry, you must add the value for sentry_dsn to your GitLab
Runner's config.toml configuration file, as referenced in GitLab Runner Advanced Configuration.
While setting up Sentry, select Go if you're asked for the project type.
If you see the following error in your GitLab Runner logs, then you should specify the deprecated DSN in Sentry.io > Project Settings > Client Keys (DSN) > Show deprecated DSN.
ERROR: Sentry failure builds=0 error=raven: dsn missing private keyError Tracking list
Users with at least Reporter permissions can find the Error Tracking list at Monitor > Error Tracking in your project's sidebar. Here, you can filter errors by title or by status (one of Ignored , Resolved, or Unresolved) and sort in descending order by Frequency, First Seen, or Last Seen. By default, the error list is ordered by Last Seen and filtered to Unresolved errors.
![]()
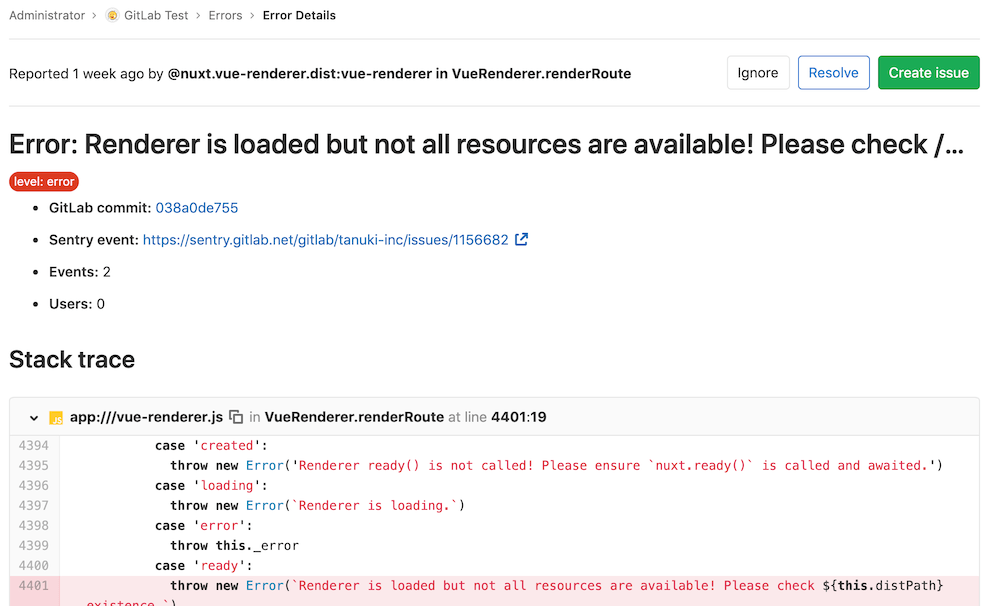
Error details
From error list, users can go to the error details page by selecting the title of any error.
This page includes:
- A link to the Sentry issue.
- A link to the GitLab commit if the Sentry release ID/version on the Sentry Issue's first release matches a commit SHA in your GitLab hosted project.
- Other details about the issue, including a full stack trace.
- In GitLab 12.7 and newer, language and urgency are displayed.
By default, a Create issue button is displayed:
If you create a GitLab issue from the error, the Create issue button changes to a View issue button and a link to the GitLab issue displays in the error detail section.
Taking action on errors
You can take action on Sentry Errors in the GitLab UI. Marking errors as ignored or resolved requires at least Developer role.
Ignoring errors
Introduced in GitLab 12.7.
In the Error Details page you can ignore a Sentry error by selecting Ignore near the top of the page.
Ignoring an error prevents it from appearing in the Error Tracking List, and silences notifications that were set up in Sentry.
Resolving errors
Introduced in GitLab 12.7.
In the Error Details page you can resolve a Sentry error by selecting Resolve near the top of the page.
Marking an error as resolved indicates that the error has stopped firing events. If a GitLab issue is linked to the error, then the issue closes.
If another event occurs, the error reverts to unresolved.
Integrated error tracking (FREE SAAS)
- Introduced in GitLab 14.4.
- Disabled in GitLab 14.9 with a flag named
integrated_error_tracking. Disabled by default.- Enabled on GitLab.com in GitLab 15.6.
NOTE: Available only on GitLab.com. This feature is in Open Beta.
Known limitations
Only basic support is provided with capture_exception as the holding method.
Additional features requests (see this issue) are added on a case-by-case basis.
Debugging issues
The majority of languages are supported by Sentry expose debug option as part of initialization.
It is also possible to output JSON before it is sent to the API.
See the Go example below for a suggested solution.
Enabling error tracking
Regardless of the programming language, you need to enable error tracking for your project. This doc assumes you already have a project for which you want to enable error tracking.
This example uses the gitlab.com instance.
To enable error tracking, follow these steps:
- On the top bar, select Main menu > Projects and find your project.
- On the left sidebar, select Settings > Monitor.
- Expand the Error Tracking tab.
- Under Enable error tracking, select the Active checkbox.
- Under Error tracking backend, select GitLab.
- Select Save changes.
- Copy the DSN string to use later.
Listing captured errors
Once your application has emitted errors to the Error Tracking API through the Sentry SDK, they should be available under Monitor > Error Tracking tab/section.
For more details, refer to the GitLab error tracking documentation.
This process assumes the GDK feature flag integrated_error_tracking is enabled. If you are running GDK locally and you do not see the option for error tracking, you can enable it by running the following commands:
cd <PATH_TO_GDK>
gdk rails console
Feature.enable(:integrated_error_tracking)
Emitting errors
Supported Sentry types
According to the data model, the available item types are:
- Event
- Transactions
- Attachment
- Session
- Sessions
- User feedback (also known as user report)
- Client report
Items of various types can be sent to the error tracking app, using either the Store endpoint, the envelope endpoint, or both. The following table lists all event types available through Sentry SDK. It also explains which endpoint can be used for ingestion and whether it is supported by GitLab Observability Backend.
Event item types can contain various interfaces, such as exception, message, stack trace, and template. You can read more about the core data interfaces in Sentry documentation.
| Item type | Interface | Can be sent through the Store endpoint | Can be sent through the Envelope endpoint | Supported |
|---|---|---|---|---|
event |
exception | {check-circle} Yes | {check-circle} Yes | {check-circle} Yes |
event |
message | {check-circle} Yes | {check-circle} Yes | {check-circle} Yes |
event |
stack trace | {check-circle} Yes | {check-circle} Yes | {check-circle} Yes |
event |
template | {check-circle} Yes | {check-circle} Yes | {dotted-circle} No |
transaction |
N/A | {dotted-circle} No | {check-circle} Yes | {dotted-circle} No |
attachment |
N/A | {dotted-circle} No | {check-circle} Yes | {dotted-circle} No |
session |
N/A | {dotted-circle} No | {check-circle} Yes | {dotted-circle} No |
sessions |
N/A | {dotted-circle} No | {check-circle} Yes | {dotted-circle} No |
user_report |
N/A | {dotted-circle} No | {check-circle} Yes | {dotted-circle} No |
client_report |
N/A | {dotted-circle} No | {check-circle} Yes | {dotted-circle} No |
Supported languages
Each language shows a basic example of how to capture exceptions with the respective SDK. For more in-depth documentation, see documentation for Sentry SDK. You can also find information for additional programming languages.
Only a subset of languages is supported.
The following table lists them:
| Sentry SDK | Supported? |
|---|---|
| Ruby | Yes |
| Go | Yes |
| JavaScript | Yes |
| Java | Yes |
| Python | Yes |
| PHP | Yes |
| .NET | Not tested |
| Android | Not tested |
| Apple | Not tested |
| Perl | Not tested |
A more up-to-date version of this matrix can be found in this doc.
Go
-
chdirinto folderdocs/guides/user/error_tracking_examples/go/ -
Install the dependencies with the following command:
go mod tidy -
Run the following command:
export SENTRY_DSN="<DSN string>"
go run main.go <DSN string>
After you've run this program, there should be an error visible in the Error tracking tab from Listing captured errors section of this document.
Ruby
-
chdirinto folderdocs/guides/user/error_tracking_examples/ruby/ -
Install the dependencies with the following command:
gem install bundler bundle install -
Execute the example with the following command:
export SENTRY_DSN="<DSN string>"
ruby app.rb
After you've run this program, there should be an error visible in the Error tracking tab from Listing captured errors section of this document.
PHP
-
chdirinto folderdocs/guides/user/error_tracking_examples/php/ -
Build and run the Docker container with the following commands:
export SENTRY_DSN="<DSN string>"
docker build -t sentry-php .
docker run -e SENTRY_DSN --rm sentry-php
After you've run this program, there should be an error visible in the Error tracking tab from Listing captured errors section of this document.
Python
-
chdirinto folderdocs/guides/user/error_tracking_examples/python/ -
Install the dependencies with the following commands:
virtualenv env source env/bin/activate pip install -r requirements.txt -
Run the following commands:
export SENTRY_DSN="<DSN string>"
python send_exception.py
After you've run this program, there should be an error visible in the Error tracking tab from Listing captured errors section of this document.
Java
-
chdirinto folderdocs/guides/user/error_tracking_examples/python/ -
Run the following command:
export SENTRY_DSN="<DSN string>"
./gradlew run
Node.js
-
chdirinto folderdocs/guides/user/error_tracking_examples/nodejs/ -
Install the dependencies with the following command:
npm install --save @sentry/node @sentry/tracing -
Run the following command:
export SENTRY_DSN="<DSN string>"
node ./test.js
After you've run this program, there should be an error visible in the Error tracking tab from Listing captured errors section of this document.
Rotating Sentry DSN
The Sentry DSN (client key) is a secret and it should not be exposed to the public. If it's leaked, you can rotate the Sentry DSN with the following steps:
-
Create an access token by clicking your profile picture in GitLab.com. Then choose Preferences,then Access Token. Make sure you add the API scope.
-
Using the error tracking API, create a new Sentry DSN with the following command:
curl --request POST --header "PRIVATE-TOKEN: <your_access_token>" --header "Content-Type: application/json" \ "https://gitlab.example.com/api/v4/projects/<your_project_number>/error_tracking/client_keys" -
Get the available client keys (Sentry DSNs). Ensure that the newly created Sentry DSN is in place. Then note down the key ID of the old client key:
curl --header "PRIVATE-TOKEN: <your_access_token>" "https://gitlab.example.com/api/v4/projects/<your_project_number>/error_tracking/client_keys" -
Delete the old client key with the following command:
curl --request DELETE --header "PRIVATE-TOKEN: <your_access_token>" "https://gitlab.example.com/api/v4/projects/<your_project_number>/error_tracking/client_keys/<key_id>"